Note
Go to the end to download the full example code.
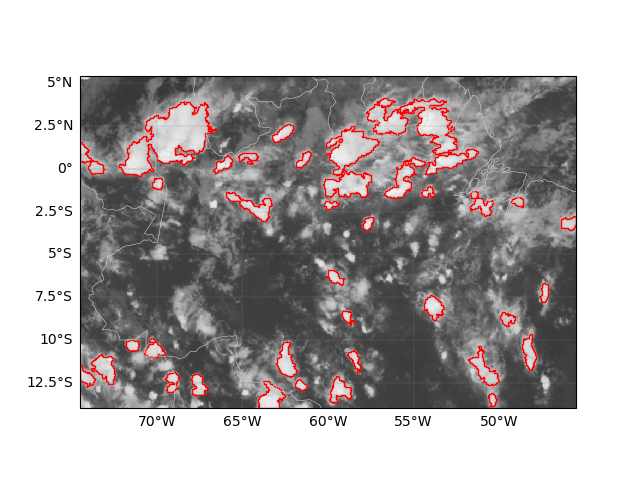
GOES-13 CS Detection
This is a general example demonstrating how detect Convective Systems using GOES-13 data from DISSM/INPE using TATHU support.
Download GOES-13 data (DISSM):   0%|          | 0/2 [00:00<?, ?files/s]
Download GOES-13 data (DISSM): 100%|██████████| 2/2 [00:00<00:00, 32768.00files/s]
Processing 2017-04-08 00:00:00
/home/docs/checkouts/readthedocs.org/user_builds/tathu/conda/latest/lib/python3.11/site-packages/cartopy/mpl/feature_artist.py:143: UserWarning: facecolor will have no effect as it has been defined as "never".
  warnings.warn('facecolor will have no effect as it has been '
import glob
from datetime import datetime

from osgeo import gdal

from tathu.constants import LAT_LONG_WGS84_BRAZIL_NORTH_EXTENT
from tathu.downloader.goes import DISSM
from tathu.progress import TqdmProgress
from tathu.satellite import goes13
from tathu.tracking import detectors
from tathu.tracking.utils import area2degrees
from tathu.utils import file2timestamp
from tathu.visualizer import MapView

### Setup Parameters ###

# Geographic area of regular grid
extent = LAT_LONG_WGS84_BRAZIL_NORTH_EXTENT

# Grid resolution (kilometers)
resolution = 4.0

# Data directory
dir = './goes13-dissm/'

# Download 08 April 2022, Channel 13, 00:xx UTC
start = end = datetime.strptime('20170408', '%Y%m%d')
hours = ['00']

# From DISSM (crop/remapped version - GOES-13)
DISSM.download('goes13', 'retangular_4km/ch4_bin',
    start, end, hours, dir,
    progress=TqdmProgress('Download GOES-13 data (DISSM)', 'files'))

# Search images
query = dir + '/**/*'

# Get files
files = sorted(glob.glob(query, recursive=True))

# Show first file
grid = goes13.sat2grid(files[0], extent, resolution, progress=gdal.TermProgress_nocb)

# Threshold value
threshold = 230 # Kelvin

# Define minimum area
minarea = 3000 # km^2

# Convert to degrees^2
minarea = area2degrees(minarea)

# Define overlap area criterion
overlapAreaCriterion = 0.1 # 10%

 # Extract timestamp
timestamp = file2timestamp(files[0], regex=goes13.DATE_REGEX, format=goes13.DATE_FORMAT)

print('Processing', timestamp)

# Create detector
detector = detectors.LessThan(threshold, minarea)

# Searching for systems
systems = detector.detect(grid)

# Adjust timestamp
for s in systems:
    s.timestamp = timestamp

# Visualize result
m = MapView(extent)
m.plotImage(grid, cmap='Greys', vmin=180.0, vmax=320.0)
m.plotSystems(systems, facecolor='none', edgecolor='red', centroids=False)
m.show()
Total running time of the script: (0 minutes 1.315 seconds)